
.
Input
Enter GEO IDs (one ID per line, maximum 10)
And/or upload your own data
Only tab-separated files are admitted, withouth header. Please check the proper format in the Help page. Download a sample file (GPL570)Analysis parameters
Meta-analysis method
Allowed missing values (%)
Adjusted P-value threshold
Group 1 name
Group 2 name
Functional analysis

Data source
GEO ID
Identifier of NCBI GEO dataset. It must begin with “GSE” followed by a numeric code (i.e. GSE10325). GSE file is a specific format from NCBI GEO which contains a gene expression matrix (Rows: genes or probe sets. Columns: samples) and all information about the experiment including annotation file and sample information. For more details, visit: http://www.ncbi.nlm.nih.gov/geo/info/datasets.html .
Your data
This web tool allows you to integrate your own data in the analysis. To upload the data, you must use the correct format (Figure 1). Your data must be saved in plain text format (.txt, or .tsv) where the first row contains “ID” in column one, followed by the sample counter in the next columns. The first value of the second row must be “NA” followed by a categorical vector (where value "0" is for group 1, "1" for group 2 and “X” if you want to exclude the sample from the analysis). The remaining rows contain the gene identifiers or the probe identifiers and, in the following columns, their expression values.
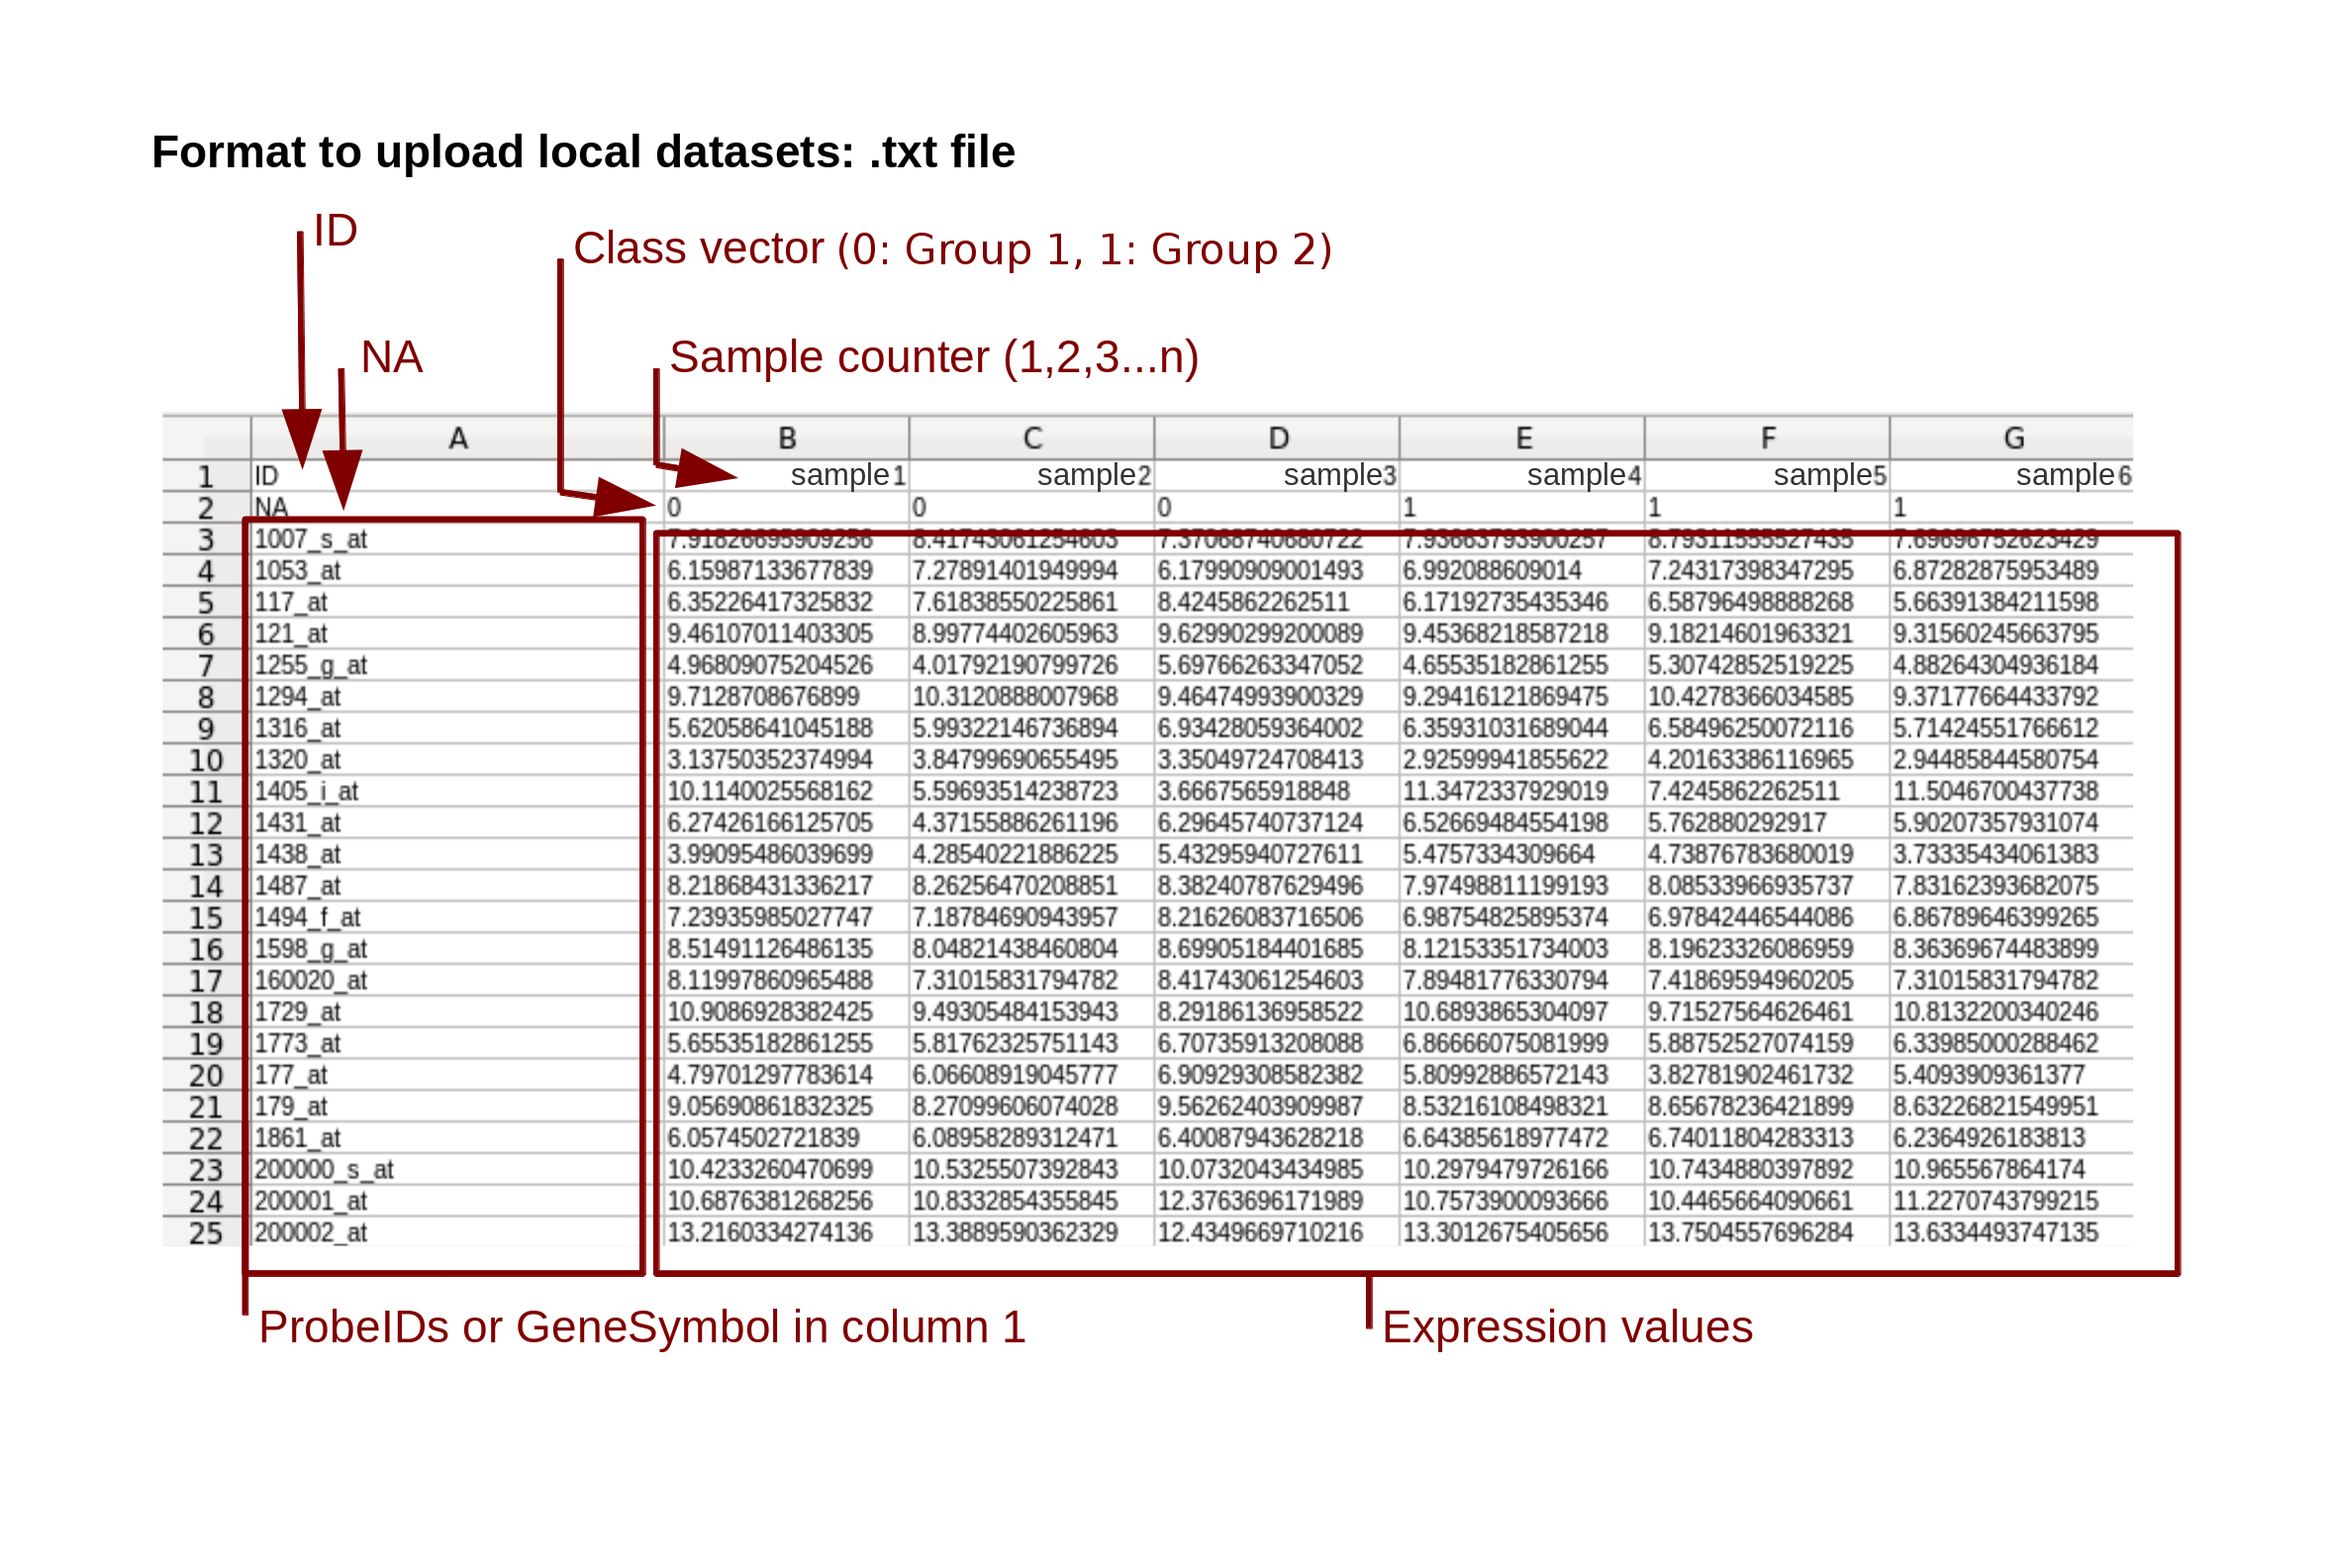
Figure 1: Data format to upload
Platforms admitted
Table 1 contains the admitted GEO platforms by ImaGEO. In addition, gene symbols can be used as gene identifiers for datasets submitted by yourself.
Table 1. Platforms admitted.
Meta-analysis methodology
A meta-analysis is a statistical analysis that combines the results of multiple scientific studies. Gene expression meta-analysis combines different expression datasets from different sources. There are two major goals in meta-analysis studies: (1) Combine the same experimental condition across different studies to increase the sample size and the statistical power. (2) Compare different experimental conditions (i.e. different diseases) to discover common and different biomarkers.
To read more about the mathematical background of the available methods in ImaGEO, enter to this link .
Sample selection
Sample Selection tab shows four tables. The one at the top (Selected samples) shows the number of cases and controls selected for each dataset. Below this table there are the buttons to change the dataset and access the information of the samples in them. That information is shown in the second table at the left botton (Unassigned samples). In this table you have to select the samples and divide them according to the user criteria into the groups previously created (Cases/Controls in the example). The last two tables are specific to those groups. To select the samples you have to select them and click the right-oriented arrows related to the convenient table (Controls/Cases). Select them again in the group table and click the left-oriented to remove them for the analysis.
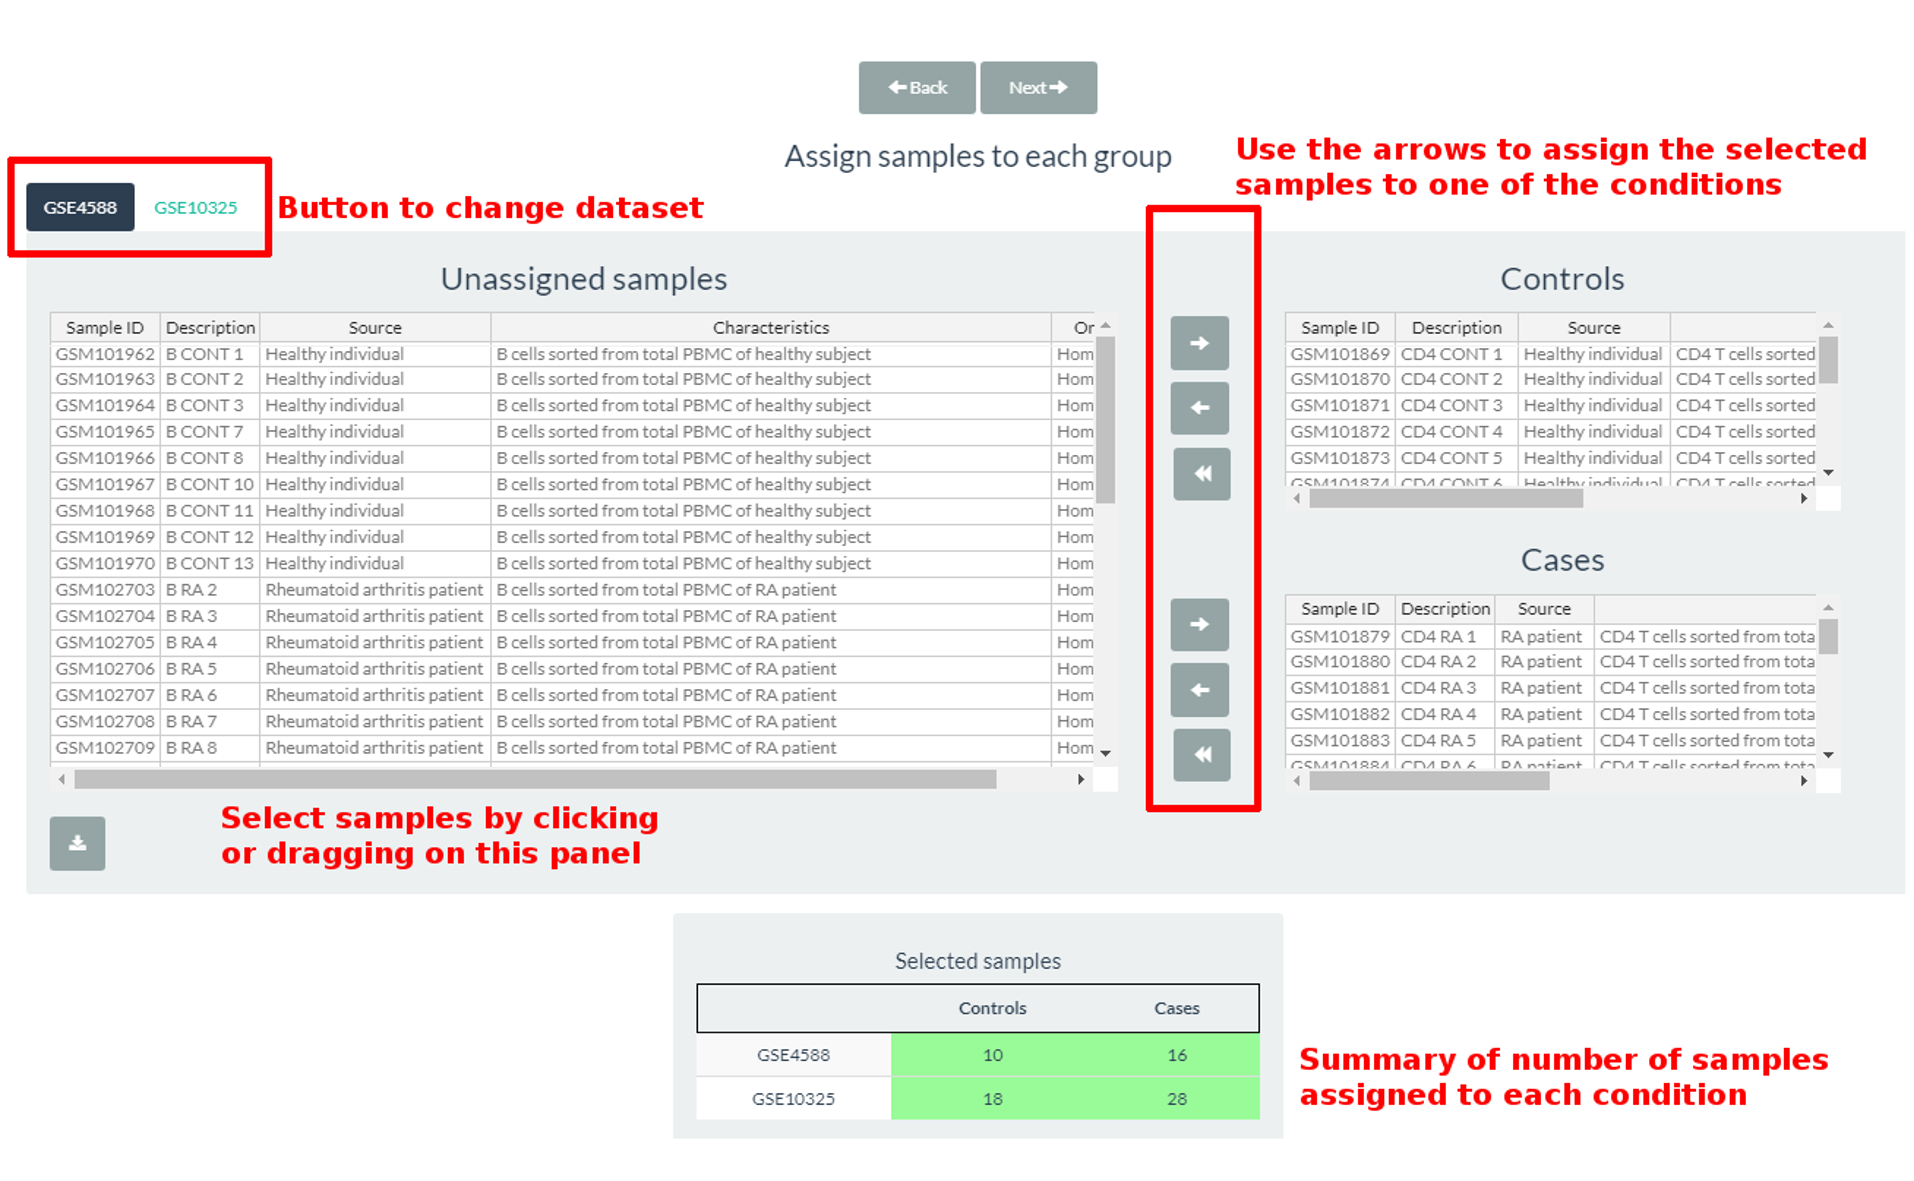
Figure 2: Sample selection
Meta-analysis results
- ID: Gene symbol
- Pval: P value is the probability for a given statistical model that, when the null hypothesis is true, the statistical summary (such as the sample mean difference between two compared groups) would be the same as or of greater magnitude than the actual observed results.
- Fdr_pval: P-value adjusted for multiple testing by FDR method
- FoldChange (only for P-value methods): fold changes are defined directly in terms of ratios. If the mean gene expression value in a set is A and for the other set is B, the fold change is defined as B/A.
- Zval (only for Effect size methods): Z value is a test statistic for Z-tests that measure the difference between an observed statistic, the gene expression levels, and its hypothesized population parameter in units of the standard deviation.
Functional analysis results
- GOBPID/GOMFID/GOCCID: Gene Ontology identifiers.
- Pvalue: P-value for each term to be significantly enriched.
- OddsRatio: the odds ratio for each category term tested
- ExpCount: number of genes in the selected gene list to be found at each tested category term.
- Count: number of genes from the gene set that are annotated at the term.
- Size: number of genes annotated at the given GO term (where genes are restricted to the defined gene universe).
- Term: descriptive name of the Gene Ontology identifiers.
Contact
If you have any doubt, question or suggestion, you can write us to bioinfo@genyo.es .
If you use ImaGEO, please include this reference:
Daniel Toro-Domínguez, Jordi Martorell-Marugán, Raúl López-Dominguez, Adrián García-Moreno, Víctor González-Rumayor, Marta E Alarcón-Riquelme, Pedro Carmona-Sáez (2018) ImaGEO: Integrative Gene Expression Meta-Analysis from GEO database. Bioinformatics. bty721, https://doi.org/10.1093/bioinformatics/bty721