

New in MetaGenyo? Go to Help tab.
Upload a file (Excel or txt)
You can try these example datasets from published papers:
- Dai.xlsx [Dai et al., 2016]
- Zhang.xlsx [Zhang et al., 2015]
- Tarabay.txt [Tarabay et al., 2016]
If you use MetaGenyo, please include this reference:
Martorell-Marugan J, Toro-Dominguez D, Alarcon-Riquelme ME, Carmona-Saez P. (2017) MetaGenyo: A web tool for meta-analysis of genetic association studies. BMC Bioinformatics. 18:563
Funnel plot
Download plot in high resolutionEgger's test
model: weighted regression with multiplicative dispersion
predictor: standard error
Leave-1-out Forest plot
Download plot in high resolutionIntroduction
MetaGenyo is a simple, ready-to-use software which has been designed to perform meta-analysis of genetic association studies.
Prepare your data
MetaGenyo requires a specific data format to worth with. The first n columns of your file can contain any type of data of the different studies that will be used at the Subgroup analysis step. N is defined by yourself. The following columns must be exactly like this:
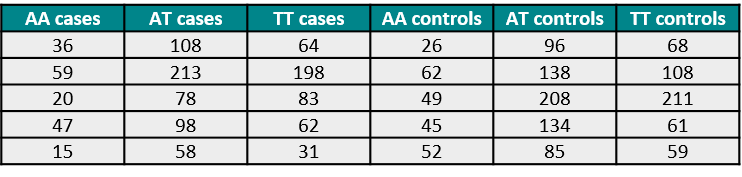
The meaning of each column are the following:
- AA cases: The number of subjects with the disease (cases) that are homozygote for the A variant.
- AT cases: The number of cases that are heterozygote for the A and T variants.
- TT cases: The number of cases that are homozygote for the T variant.
- AA/AT/TT controls: The same as the previous columns, but for the amounts of subjects with no disease (controls)
In conclusion, your data should be something like this (remember that previous columns to "AA cases" column are chosen by yourself):
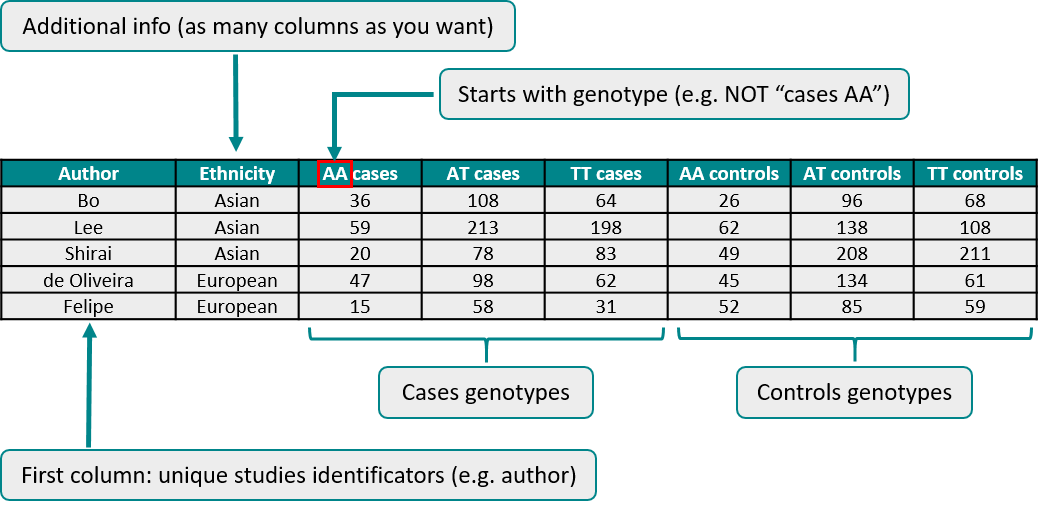
You can write the column names that you want to (but there MUST be column names). But there are some exceptions: column names with genotyping data must start with the genotype (AA.cases it's correct, but cases.AA it's not). Missing values are not allowed. Be sure that your data is in the correct order.
Once you have all your data, you must save it in a suitable format for MetaGenyo. The tool accepts Excel files (.xls and .xlsx) and plain text files.
Submit your data
Once you have prepared your data, you are ready to use MetaGenyo. First, enter to the webpage, press "Browse..." button and select your data file. Now:
- If you submitted an Excel file you have to select which is the risk allele in your data (th.
- If you submitted a plain text file you have to specify separator and quote type of your file in addition to the risk allele.
Review your data
Once you have submitted your data, you must click "Your data" tab to review it. If your data looks nice and no error appears, it means that you submitted your data correctly and you can continue with the following steps. Otherwise, you must return to "Data input" tab and review that options selected correspond to your data characteristics. Maybe you should review your input file too.
Hardy-Weinberg table
In this tab, you will find your data with two columns added: HW.P.value and HW.adjusted.P.value . The first one contains the p-value of chi-square test for Hardy-Weinberg Equilibrium (HWE) for the control data of each study you included. The second one contains these p-values corrected for multiple testing by FDR mehod. This is a way to check study quality: if p-value is significant, control genotypes may not be in HWE and you should be careful with that study data or exclude it. That's because departures from HWE can occur due to genotyping errors, selection bias in the choosing of controls and stratification [1]. If you want to exclude some study, just delete it from your data and resubmit your file.
You can download the results in Excel (.xls), comma-separated values (.csv) and tab-separated values (.tsv) formats. Simply choose your desired format and press "Download" button. You can also interact with the results in the table showed.
Association values
In this tab, you will find association test results calculated for the comparison that you choose on the left panel. These results are:
- Association test results
- Number of studies included in your meta-analysis
- Results table for fixed and random models:
- OR: Odds-ratio
- 95%-CI: 95 % confidence interval for the OR
- p-value: Probability that the SNP is NOT associated with the studied phenotype
- adjusted p-value: P-value corrected for testing the association in different ways by Bonferroni method
- Test of heterogeneity:
- tau^2: Estimate of total amount of heterogeneity
- H: Proportion of total variability due to heterogeneity
- I^2: Proportion of inter-study variability attributed to chance rather than heterogeneity
- Q: Q value for Cochran's Q test. This test is used to determine if variations are due to chance or they are due to differences between studies [2]
- p.value: Heterogeneity p-value. If this value is lower than 0.10, it indicates the presence of heterogeneity [3]
Forest plots
In this tab, you will find a forest plot for the comparison that you choose on the left. A forest plot gives a visual representation of the variation between the studies included in your meta-analysis for the selected comparison [4]. It also provides an estimation of the global result of all the studies.
Publication bias
In this tab, you will first find a funnel plot for the chosen comparison on the left. This plot is a graphical test to check if publication bias exists in your meta-analysis [5]. If the funnel plot is similar to a symmetrical inverted funnel, there is not publication bias in your data. On the other hand, if there is asymmetry maybe publication bias exists ini your data, so the results of your meta-analysis must be interpreted carefully [6].
In this tab you will also find Egger's test results for your data and selected comparison. This is a more objective way to detect publication bias [5]. If Egger's regression test p-value is lower than 0.05, publication bias is possibly present in your meta-analysis.
Subgroup analysis
In this tab, you can choose a column of your data and stratify the studies based on this column. A table will be generated with some results of the meta-analysis for each of the groups formed. The test of association is calculated with fixed or random effect model, depending on the test of heterogeneity: If p-value < 0.1, random effect model will be used. Otherwise, fixed effect model will be used instead. If there is any group formed by one single study, this group will not appear in the results (obviously, meta-analysis can't be performed with one study).
These tables can be very useful to easily detect statistically significant associations in subgroups when no results are obtained including all the studies. The generated table can be also useful as a summary if subgrouping column is not selected.
Sensitivity
In this tab, you will find a forest plot for the robustness analysis by leave.one-out method. The analysis is repeated excluding one study each time in order to visualize if any study has a significantly greater contribution to overall statistics that the other studies.
References
- Salanti G, Amountza G, Ntzani EE, loannidis JP. Hardy-Weinberg equilibrium in genetic association studies: an empirical evaluation of reporting, deviations, and power. Eur J Hum Genet 2005;13:840-8.
- Whitehead A and Whitehead J. A general parametric approach to the meta-analysis of randomized clinical trials. Stat Med 1991;10:1665-77.
- Munafò MR and Flint J. Meta-analysis of genetic association studies. Trends Genet 2004;20:439-44.
- Lewis S, Clarke M (2001). Forest Plots: Trying to See the Wood and the Trees. British Medical Journal, 322(7300), 1479–1480.
- Egger M, Davey Smith G, Schneider M, Minder C. Bias in meta-analysis detected by a simple, graphical test. BMJ 1997;315:629-34.
- Y Lau J, loannidis JP, Terrin N, Schmid CH, Olkin I. The case of the misleading funnel plot. BMJ 2006;333:597-600.
- Dai X, Zhang X, Wang B, Wang C, Jiang J, Wu C. Association Between Polymorphism rs678653 in Human Cyclin D1 Gene (CCND1) and Susceptibility to Cancer: A Meta-Analysis. Medical Science Monitor : International Medical Journal of Experimental and Clinical Research. 2016;22:863-874.
- Zhang Y, Zeng X, Lu H, Li Y, Ji H. Association between Interleukin-8-251A/T polymorphism and gastric cancer susceptibility: a meta-analysis based on 5286 cases and 8000 controls. International Journal of Clinical and Experimental Medicine. 2015;8(12):22393-22402.
- Tarabay M, Elshazli R, Settin A. African vs. Caucasian and Asian difference for the association of interleukin-10 promotor polymorphisms with type 2 diabetes mellitus (a meta-analysis study). Meta Gene. 2016;9:10-17.
Example datasets extracted from:
Contact info
If you have any doubt, question or suggestion, you can write us to bioinfo@genyo.es .